
Resources
Where the numbers come from.
Every figure in a Money with Mara lesson traces back to a source you can check yourself. Share the charts, then check the sources. Don't trust, verify.
Data explainers · free to share
See the numbers
Our charts, built from official data. Click any chart for the full-size version. Share them with credit to Money with Mara.
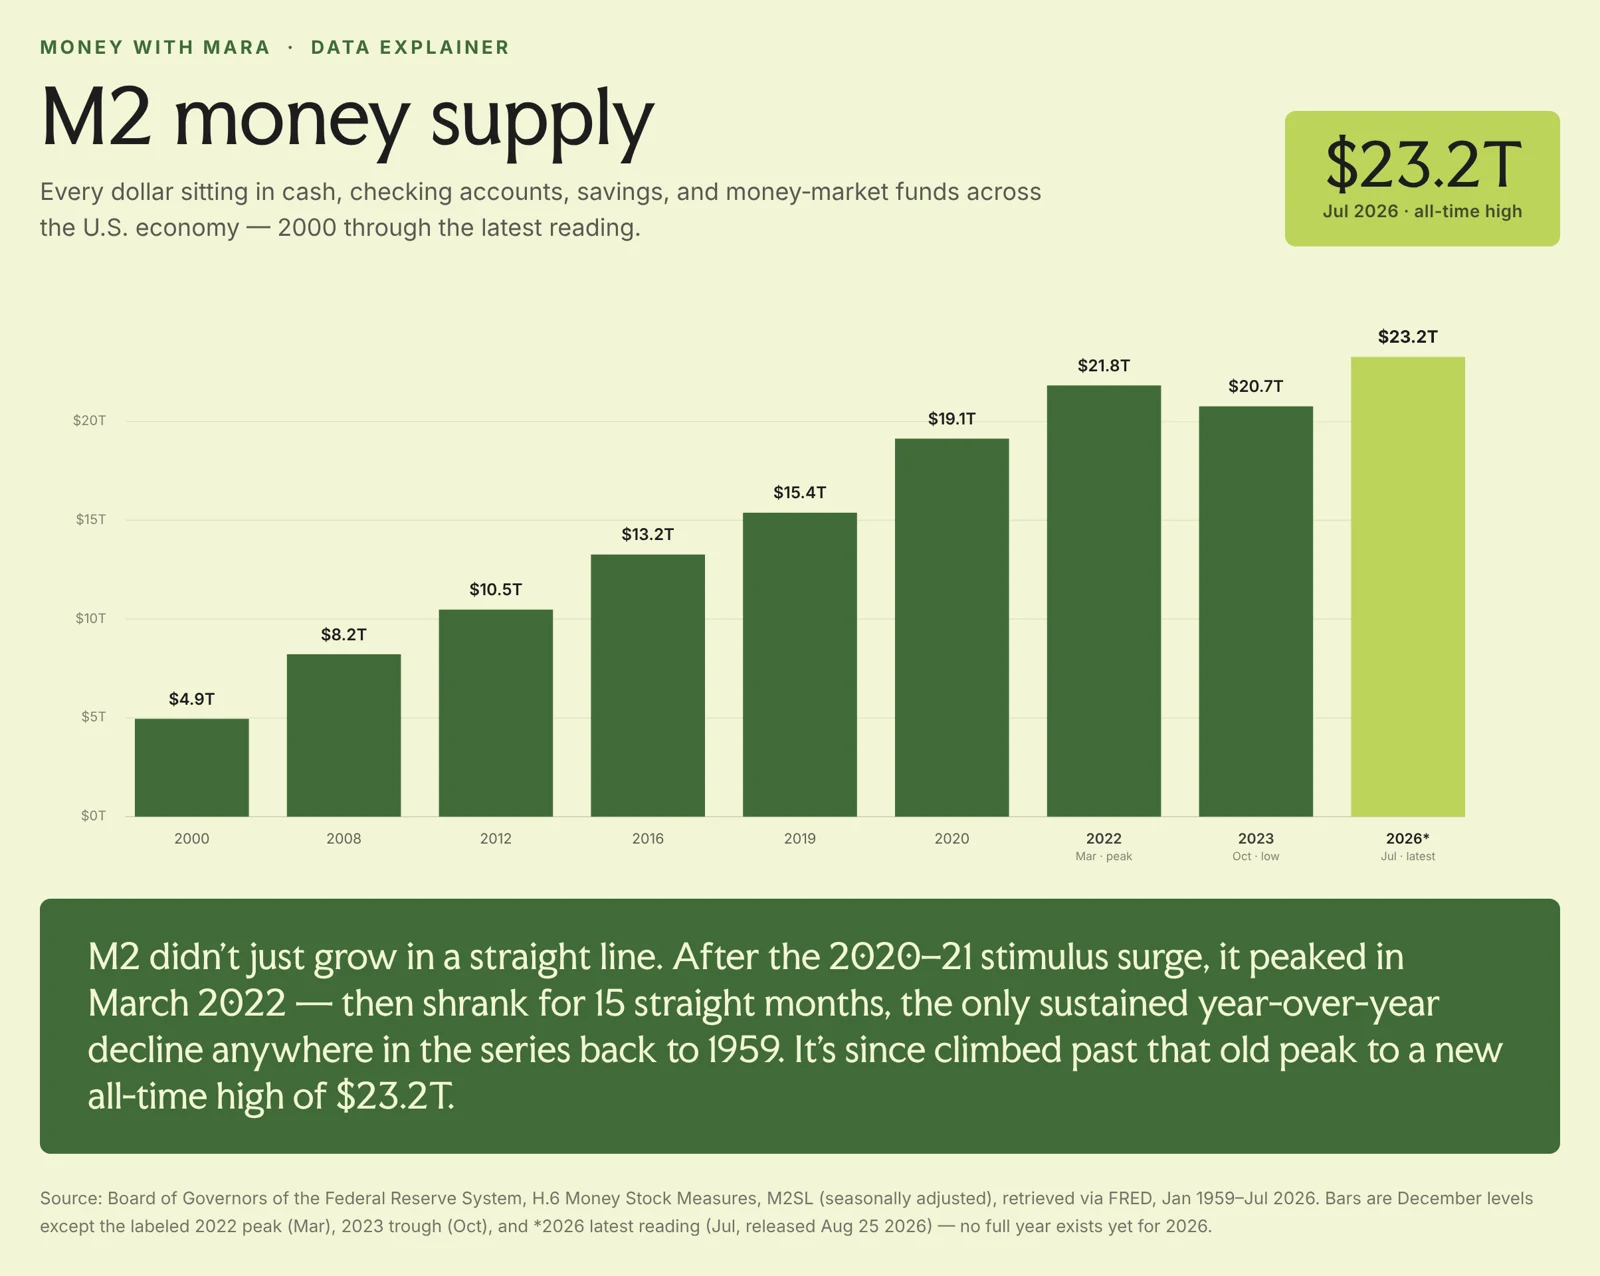
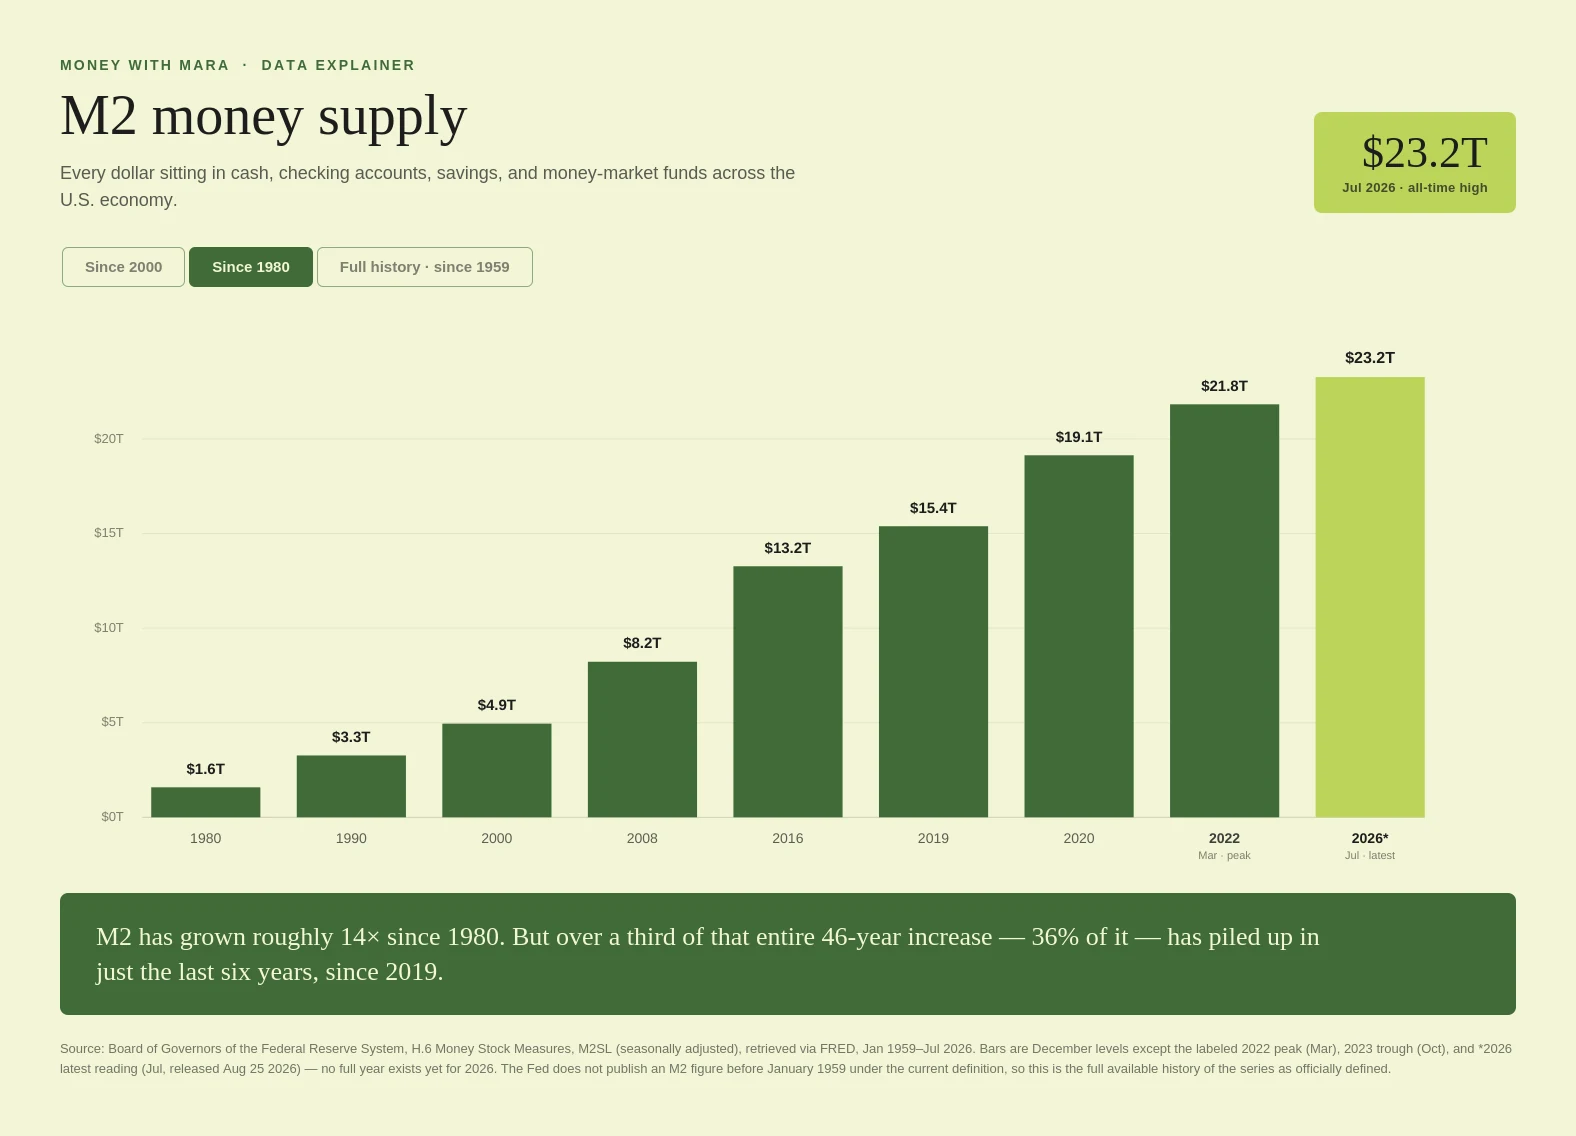
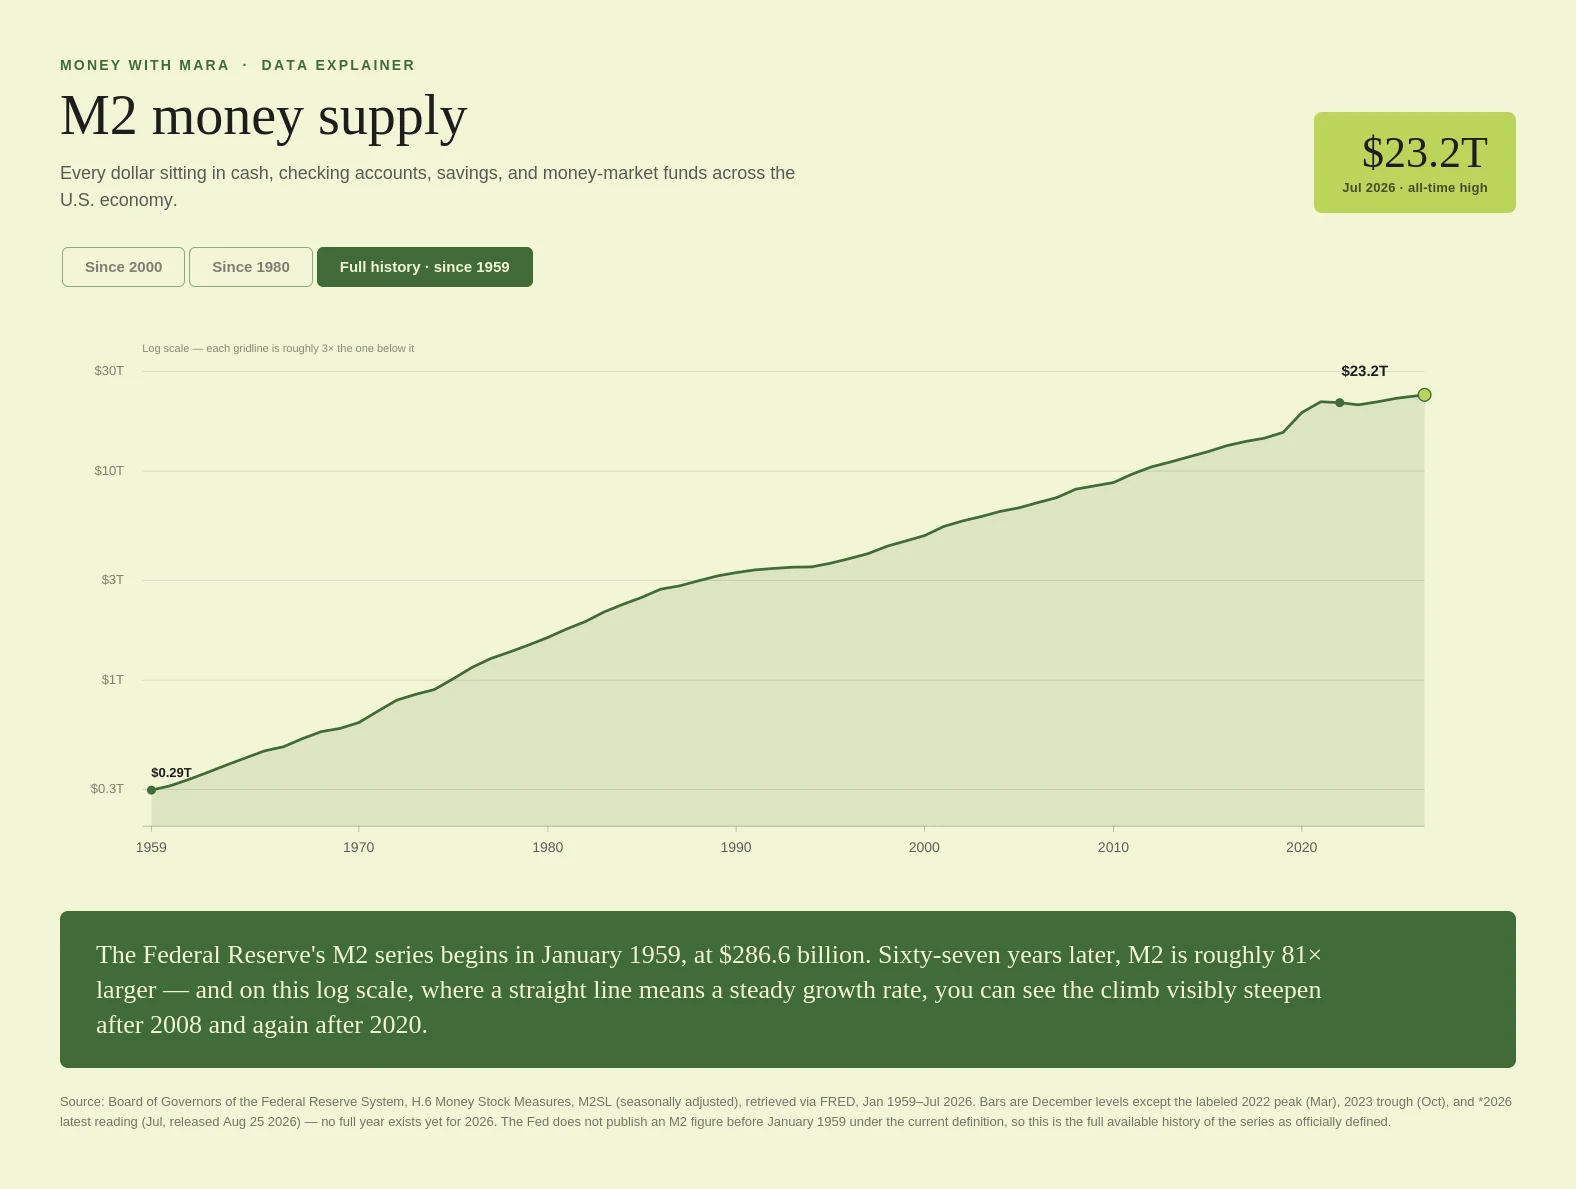
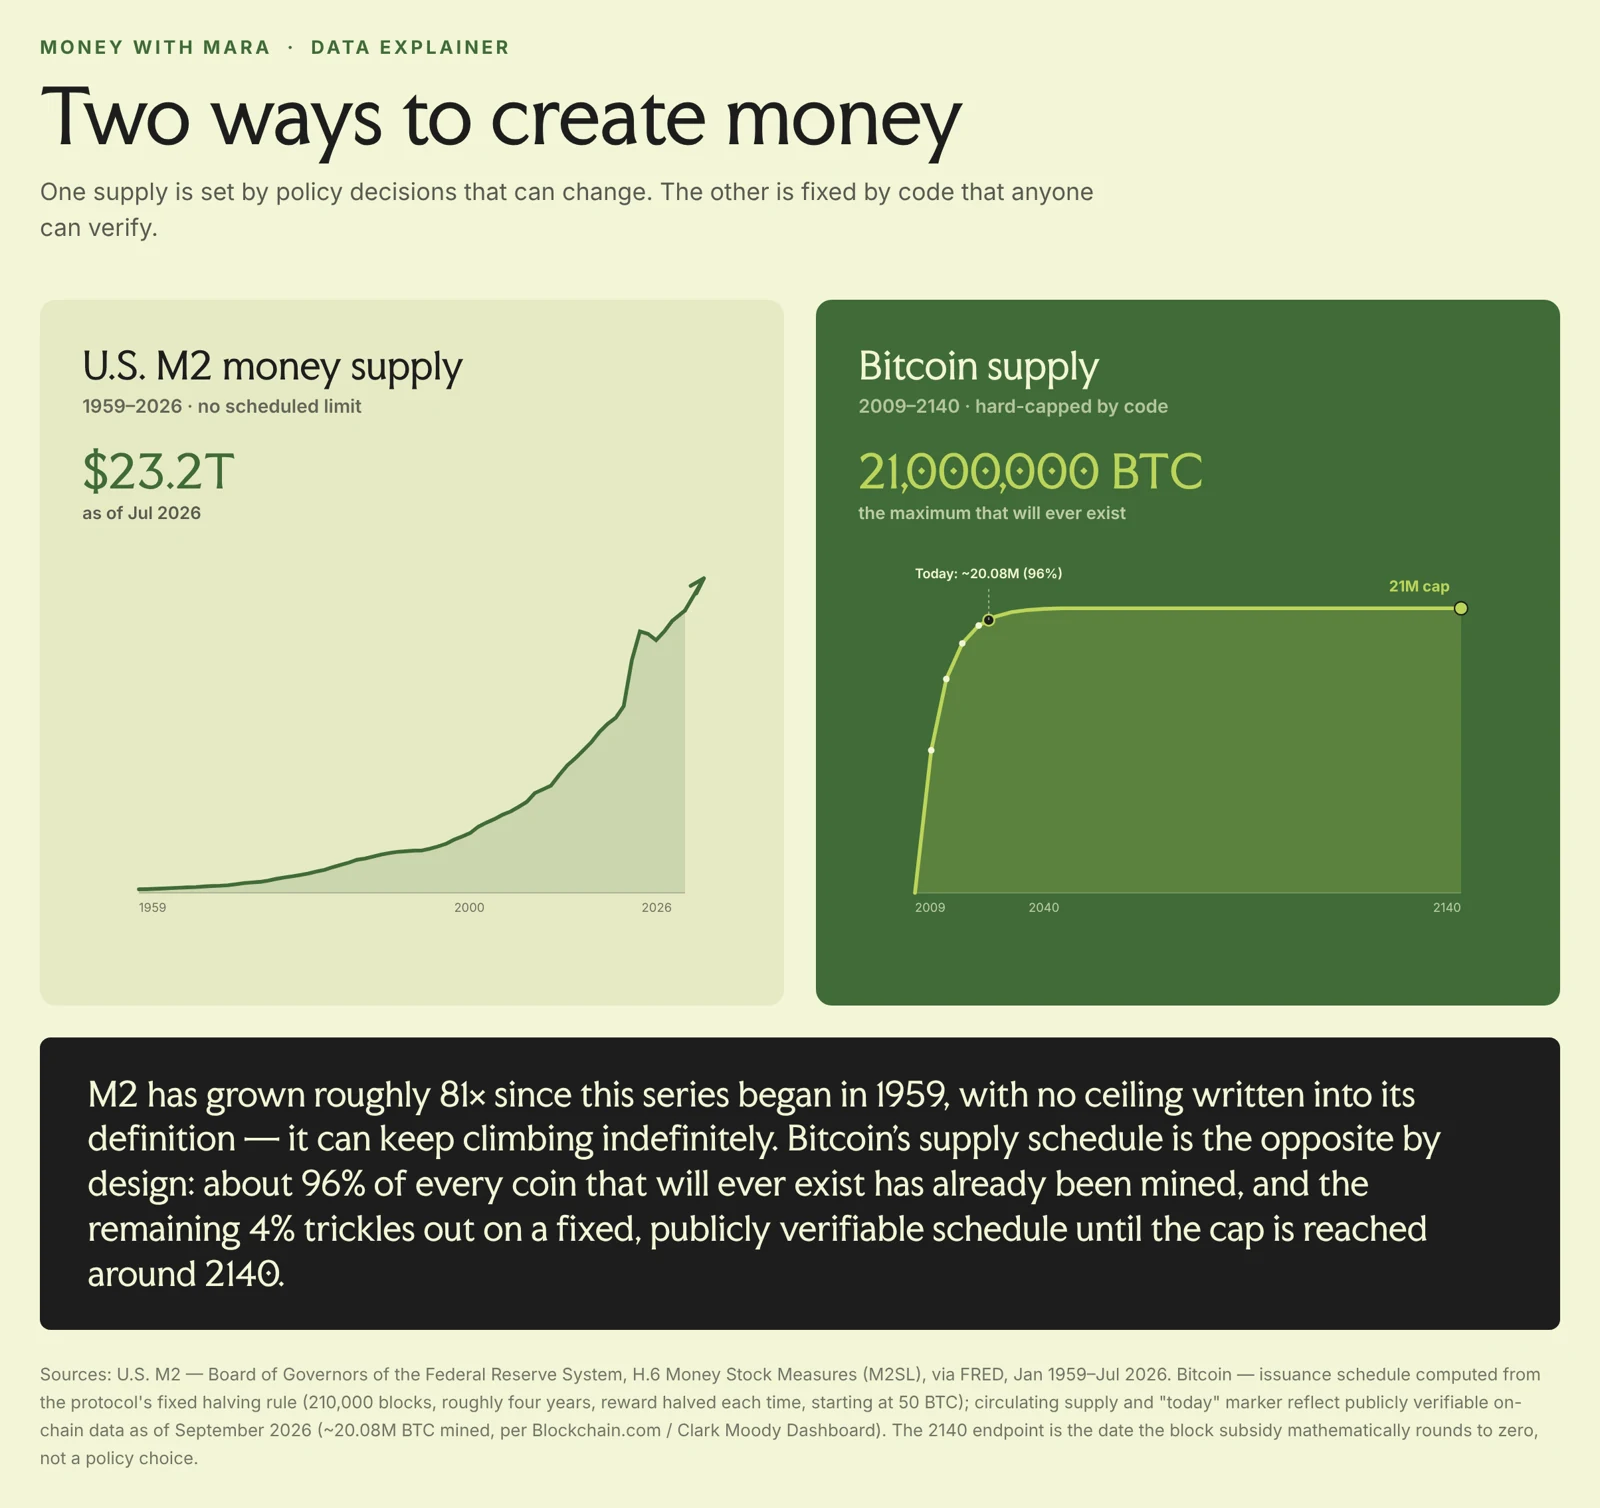
Data: Board of Governors of the Federal Reserve System, M2 money stock (M2SL), via FRED, Jan. 1959 to Jul. 2026. Bitcoin issuance follows the protocol's fixed halving schedule; circulating supply as of September 2026.
Data sources
Official numbers
- DebtU.S. Treasury, Debt to the PennyThe official total federal debt, updated every business day.
- BudgetCBO, Monthly Budget ReviewHow big the deficit is so far this fiscal year.
- ProjectionsCBO, The Budget and Economic Outlook: 2026 to 2036Where debt and interest costs are headed over the next decade.
- Money supplyFRED, M2 money stock (M2SL)How many easy-to-reach dollars exist, monthly since 1959.
- PricesBLS, Consumer Price IndexThe government's main measure of inflation.
Tools
See it for yourself
- LiveU.S. Debt ClockRunning estimates of debt, deficits and more. An independent site, not affiliated with Money with Mara.
- ChartsFRED economic dataFree charts and downloads from the Federal Reserve Bank of St. Louis.
- OursMoney with Mara debt clockOur live estimate on the homepage, with the method shown.
- OursMoney with Mara dictionaryEvery word from the lessons, in plain English. Mixing up debt and deficit? Compare them.
- OursThe $40 Trillion QuestionWhere these numbers come together: deficit, debt, who we owe and the interest bill.
Follow the moneyM2 chartsBitcoin price chartReserve WatchWatch: visualizing the debt